Understanding Phase Transitions in the Checkerboard State
Written on
Chapter 1: Introduction to Phase Transitions
In a previous discussion, I explored how researchers arranged Rubidium atoms into an array, subsequently exciting them to form a checkerboard pattern with alternating energy levels. This prompts questions about the appearance of the system as it transitions to the checkerboard phase and the intriguing behaviors observed near the critical point of this transformation. The study of phase transitions provides insights into these phenomena. Critical exponents refer to the numerical values that define the power-law relationships between observable physical quantities.
Correlation Lengths
One significant aspect of this research is how the correlation lengths expand as the system's detuning increases, facilitating the transition to the checkerboard phase. Initially, all atoms are in their ground state. As we increase the ratio of detuning, we observe the correlation lengths. A faster increase in this ratio corresponds to larger measured correlation lengths. This behavior can be understood through the quantum Kibble-Zurek Mechanism, which describes the breakdown of correlations near critical points. In physics, the term "relaxation" typically denotes the process of returning a disturbed system to equilibrium. For instance, we might examine how swiftly an oscillating spring returns to its rest position after a disturbance. Each relaxation process can be characterized by a relaxation time.

Transitioning from Order to Disorder
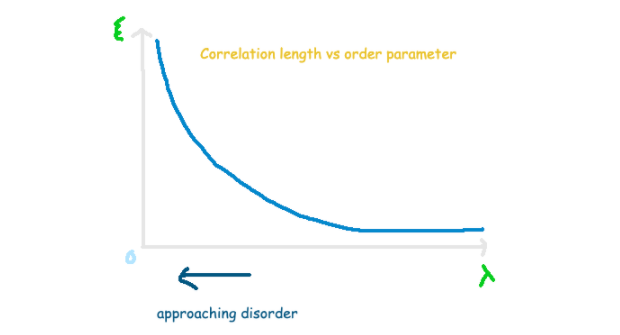
To better understand the shift from a disordered phase to the ordered checkerboard phase, we can simplify the explanation by assuming a critical point where our order parameter equals zero. According to standard critical theory, as we adjust the detuning from negative to positive values, we anticipate variations in correlation length and relaxation time, as described below. The Greek letter Lambda symbolizes our control parameter, which we manipulate during the experiment.

The Greek exponent nu is known as the critical exponent, which primarily indicates how correlations between atoms evolve as we transition from a disordered to an ordered state. As the order parameter nears zero, the correlation length diverges, suggesting a breakdown of local structure. Tau represents the relaxation time, while z serves as a scaling factor connecting correlation lengths to relaxation times.
Increasing Sweep Rates and Correlation Growth
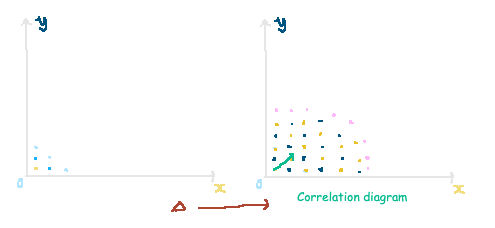
As we increase the detuning towards positive values, the correlations among atom pairs intensify, leading us into the checkerboard phase. This progression is visualized in the accompanying diagram, which depicts the correlations between atoms based on vector displacement. As the detuning parameter turns positive, we witness a strengthening of these correlations, culminating in the checkerboard state characterized by alternating energy levels of the Rubidium atoms. The subsequent heat-map illustrates the correlation intensity for pairs of atoms displaced by a specified vector.

The speed at which we transition into the checkerboard phase is determined by the sweep rate of our system, which reflects how rapidly we alter the control parameter (detuning) over time. The formula detailing this relationship is presented below.

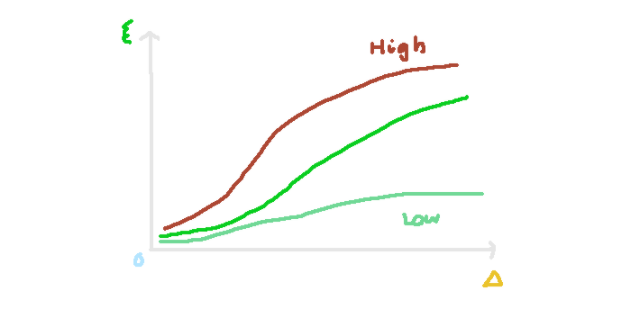
Within this framework, a quicker sweep rate results in a reduced correlation length. The sweep rates influence the growth of correlation lengths, yet the Kibble-Zurek mechanism suggests that all these curves can be normalized into a single representation, facilitating the identification of critical exponents. The graph below highlights various curves that illustrate the connection between correlation length and detuning parameter. Notably, higher sweep rates yield elevated curves, indicating that a more rapid detuning correlates with stronger correlations.

Identifying the Critical Point for Detuning
A critical value exists for our control parameter, at which a phase transition occurs. For a lattice of Rydberg Rubidium atoms, this critical point corresponds to the peak of the material’s susceptibility. The susceptibility is defined as the average proportion of atoms occupying the Rydberg state. The rate of change of this proportion concerning the detuning parameter indicates susceptibility. The point at which susceptibility reaches its maximum marks our critical point.

Once the critical point for detuning is established, we can measure the critical exponent nu. In the referenced study, this value was estimated at 0.624, which aligns well with the predicted value of 0.629 from another source. Future discussions will delve into the numerical predictions of this parameter!
References
[3] Sepehr Ebadi et al. Quantum Phases of Matter on a 256-Atom Programmable Quantum Simulator, arXiv:2012.12281 [quant-ph].