Understanding Digital Signal Processing: A Beginner's Guide
Written on
Chapter 1: Introduction to Digital Signal Processing
Digital signal processing (DSP) might seem like a complex concept, but it can be broken down into simple components using basic mathematics.

You may wonder how music production, photo analysis, and wearable technology like fitness trackers are connected. At first glance, these activities appear unrelated, yet they share a common foundation: digital signal processing.

Digital signals can be visualized as graphs representing various data sources. Devices like heart monitors, music production software, and fitness applications collect and analyze this data in graphical formats. While the topic may seem daunting, we will use visual methods to demystify this valuable technique for examining numerous phenomena in the world. Additionally, we will explore how to deconstruct and manipulate digital signals using straightforward mathematical concepts, such as Fourier analysis (pronounced "Foe-ree-YAY"). Python will be our tool of choice for this exploration.
Section 1.1: Defining Digital Signal Processing
Digital signal processing encompasses various functions, including:
- Counting steps from walking data
- Modifying song pitch
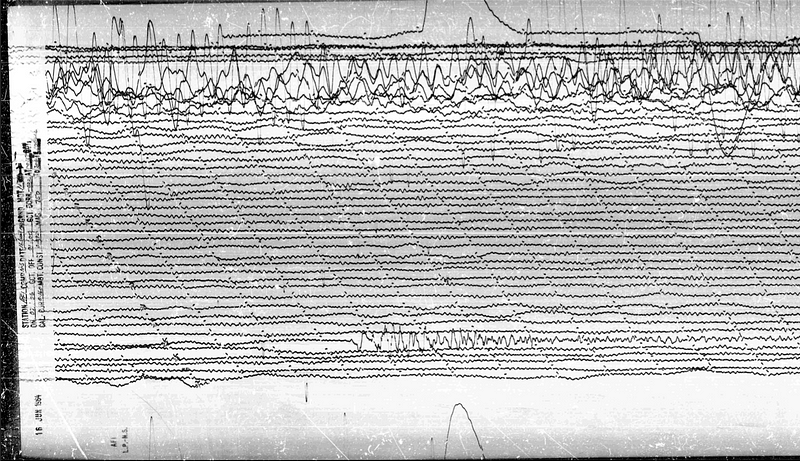
- Analyzing seismic activity
- Detecting heartbeats in electrocardiograms
- Differentiating between images of a husky and a wolf

Signals can take many forms, such as sound, electrical consumption, or even images. (We will delve into this concept later in the series.) The versatility of DSP extends to various scientific fields, from converting electrical signals into binary code that computers can process to interpreting radio signals from satellites.

This tutorial series will explore a variety of applications, emphasizing how to leverage Python and SciPy to achieve these tasks.
Section 1.2: Future Topics in This Series
As we progress through this series, the following topics will be explored:
- Understanding Digital Signal Processing (this article)
- Graphing Digital Signals
- Identifying Peaks and Troughs in Signals
- Signal Smoothing Techniques
- Filling in Signal Gaps
- Analyzing Frequency Components (Fourier Analysis)
- Removing Frequencies from Signals
- Adjusting Frequency Levels
- Navigating SciPy’s "Signal" Library Parameters
- Understanding SciPy’s "FFT" Library Parameters
- Implementing Fourier Transforms in Python
Applied Topics:
- Counting Steps from Movement Data
- Analyzing Electrocardiograms for Heart Disease Detection
- Predicting Flooding Scenarios
- Detecting Image Manipulation with Python
- Creating a Digital Piano Chord in Python
- Analyzing Brain Activity with Electroencephalograms
- MRI and CT Scan Analysis in Python
Questions and Feedback
For inquiries or feedback, reach out via email at [email protected] or connect with us on Instagram (@protobioengineering). If you found this article informative, consider supporting us by buying a coffee.