Harnessing Autocorrelation for Trading Insights
Written on
Understanding Autocorrelation in Trading
Autocorrelation refers to the linear correlation of a variable with its own past values. Analyzing autocorrelation can provide valuable insights into market behavior. For instance, consistent positive autocorrelation often indicates a trending market, while negative autocorrelation tends to occur in ranging markets.
For a comprehensive guide to contrarian trading strategies, consider my book that covers an extensive array of both classical and contemporary techniques, delving deeply into technical analysis with various trading methods. It also features its own GitHub repository for practical application.
Contrarian Trading Strategies in Python
Amazon.com: Contrarian Trading Strategies in Python: 9798434008075: Kaabar, Sofien: Books
The Concept Behind Trading Signals
Correlation measures the linear relationship between two variables and ranges from -1.00 to 1.00. Here’s how to interpret these values:
- 1.00: Perfect positive correlation, both variables move together continuously.
- 0.70: Strong positive correlation, variables primarily move in the same direction.
- 0.00: No correlation; the variables are independent.
- -0.70: Strong negative correlation, variables generally move in opposite directions.
- -1.00: Perfect negative correlation, the variables consistently move apart.
It’s crucial to remember that correlation does not equate to causation, which necessitates cautious interpretation of results.
Autocorrelation examines how a variable, such as price, relates to its previous values over time. Understanding this can help identify market regimes. The forthcoming indicator we will create utilizes autocorrelation alongside the concept of mean reversion, where high correlation suggests a return to normality in cycles. A plot of autocorrelation will typically oscillate between negative and positive values, offering predictive insights on potential reversals.
Coding the Autocorrelation Indicator in TradingView
The aim of the indicator is to compute the autocorrelation of price over various periods, producing multiple indicators that fluctuate between -1.00 and 1.00. The indicator signals at 0.75, which implies:
- If all 10 autocorrelation indicators exceed 0.75 and the RSI is below 50, a bullish reversal may follow.
- Conversely, if all 10 indicators surpass 0.75 while the RSI is above 50, a bearish reversal might occur.
This indicator does not provide directional signals; it only indicates potential reversals, with the directional aspect determined by the RSI.
indicator("K's Correlation Indicator", overlay = true)
upper_threshold = input(defval = 0.75, title = 'Threshold')
auto_correl_1 = ta.correlation(close, close[1], 2)
auto_correl_2 = ta.correlation(close, close[2], 3)
auto_correl_3 = ta.correlation(close, close[3], 4)
auto_correl_4 = ta.correlation(close, close[4], 5)
auto_correl_5 = ta.correlation(close, close[5], 6)
auto_correl_6 = ta.correlation(close, close[6], 7)
auto_correl_7 = ta.correlation(close, close[7], 8)
auto_correl_8 = ta.correlation(close, close[8], 9)
auto_correl_9 = ta.correlation(close, close[9], 10)
auto_correl_10 = ta.correlation(close, close[10], 11)
buy_signal = ta.rsi(close, 14) <= 50 and auto_correl_1 >= upper_threshold and auto_correl_2 >= upper_threshold and auto_correl_3 >= upper_threshold and auto_correl_4 >= upper_threshold and auto_correl_5 >= upper_threshold and auto_correl_6 >= upper_threshold and auto_correl_7 >= upper_threshold and auto_correl_8 >= upper_threshold and auto_correl_9 >= upper_threshold
sell_signal = ta.rsi(close, 14) >= 50 and auto_correl_1 >= upper_threshold and auto_correl_2 >= upper_threshold and auto_correl_3 >= upper_threshold and auto_correl_4 >= upper_threshold and auto_correl_5 >= upper_threshold and auto_correl_6 >= upper_threshold and auto_correl_7 >= upper_threshold and auto_correl_8 >= upper_threshold and auto_correl_9 >= upper_threshold
plotshape(buy_signal, style = shape.triangleup, color = color.green, location = location.belowbar, size = size.small)
plotshape(sell_signal, style = shape.triangledown, color = color.red, location = location.abovebar, size = size.small)
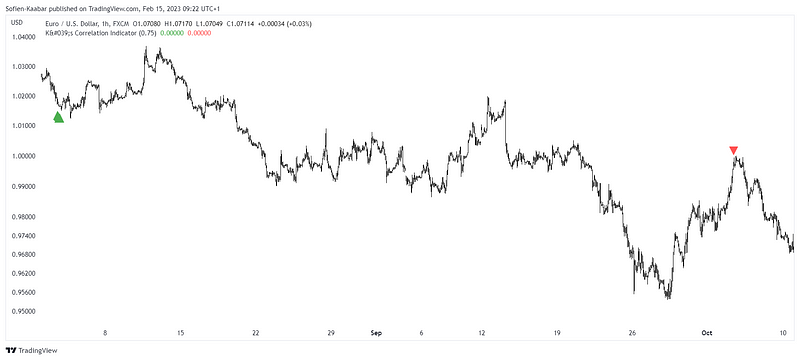
The following figure illustrates a signal chart:

Exploring Further Signal Charts
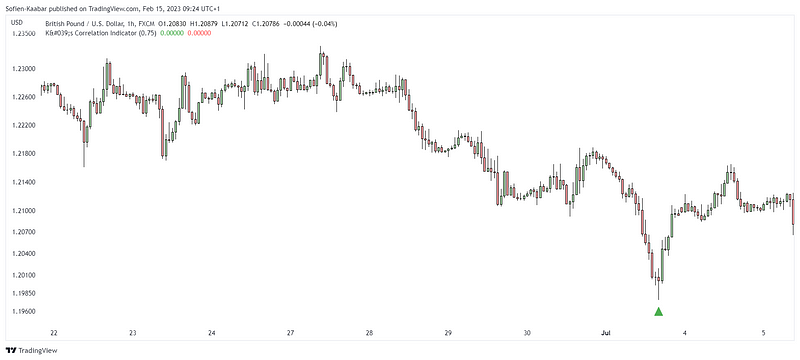
Here’s another representation of the signal chart:

This indicator holds significant potential and should be optimized, especially when integrated with other analytical tools. For those interested in creating diverse algorithms, I highly recommend checking out Lumiwealth, which offers detailed courses covering algorithmic trading, blockchain, and machine learning.
Learn Algorithmic Trading with Python on Lumiwealth
Summary of Key Insights
In conclusion, my goal is to contribute to the domain of objective technical analysis by advocating for transparent techniques and strategies that warrant back-testing before application. This approach aims to eliminate the negative stigma associated with technical analysis being overly subjective and lacking scientific basis.
Whenever you encounter a trading technique or strategy, I advise adhering to these essential steps:
- Maintain a critical perspective and remain emotion-free.
- Back-test the strategy using realistic simulations.
- If it shows promise, optimize and conduct forward testing.
- Always account for transaction costs and slippage in your assessments.
- Implement risk management and position sizing in your strategies.
Lastly, even after thorough validation, stay vigilant and continually monitor your strategy, as market conditions can change, potentially affecting profitability.
Autocorrelation in Trading | Quantra Course - YouTube
Explore the relationship between autocorrelation and trading signals in this insightful video.
Pitch of a Piano Key Using Autocorrelation - YouTube
Discover how autocorrelation applies to understanding sound and musical theory in this engaging video.